Jump to:
Installation
The RsPKanalix package can be downloaded from here.
To use the package, you have to install R programming language and, although it is not required, we strongly recommend using RStudio, a free and open-source IDE for R.
Before the installation of the RsPKanalix package, ensure that you have installed the lixoftConnectors package (installation instructions). Since the RsPKanalix package is not yet available on CRAN (central repository of R packages), the easiest way to install the package with its dependencies is using devtools package. You can install the devtools package from CRAN.
install.packages("devtools")
After installing the devtools package, set the working directory to the directory in which the RsPKanalix installation file is in by clicking on Session > Set Working Directory > Choose Directory…
Then run the following commands:
library(devtools)
install_local("RsPKanalix.tar.gz", dependencies = TRUE)
Alternative way of installing includes manual installation of dependencies:
install.packages("dplyr")
install.packages("flextable")
install.packages("ggplot2")
install.packages("ggpubr")
install.packages("magrittr")
install.packages("officer")
install.packages("openxlsx")
install.packages("Rcpp")
install.packages("readxl")
install.packages("stats")
install.packages("RsPKanalix.tar.gz", repos = NULL, type = "source")
This manual uses examples that can be downloaded from here.
Data formatting
The MonolixSuite takes as input a dataset that integrates all the information on observations such as concentrations (including limits of quantification) and doses (amounts and times), and that meet specific requirements like a single header line or a particular encoding of different periods of samples. The RsPKanalix package includes a function that allows to format for PKanalix a dataset that does not meet the formatting requirements.
Data formatting in the RsPKanalix package is done through the formatData function. This function accepts many input arguments allowing a high flexibility for the format of your original dataset. It can not only create an adapted dataset but also a PKanalix project, depending on the status of the createProject argument.
Example usage
By default, if using plasma concentration data, correct dataFilename, idHeader, timeHeader and obsHeader arguments need to be set in order for the function to work as intended.
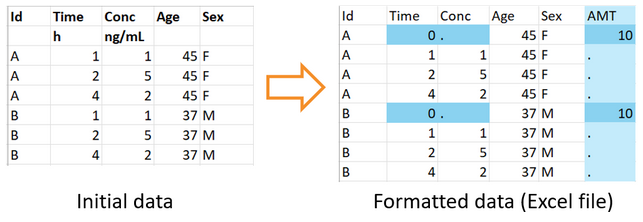
Here is an example of how to call the formatData function on an example dataset not suitable for use with MonolixSuite, a part of which is shown below.
The output filename can correspond to a csv file or an Excel file. In that case, changes in the formatted data are highlighted in the Excel file with a color code, and a csv file with the same name is saved as well.
In this example, the function adds a single single dose at time 0 for each individual of the data. Since the second header line with units cannot be read by PKanalix, it is also removed.
formatData(
  dataFilename = "ex1.csv",
  idHeader = "Id",
  timeHeader = "Time",
  obsHeader = "Conc",
  timeFirstDose = 0, doseAmount = 10,
  outputFilename = "formatted_dataset.xlsx"
)
Below we show the same example with additional arguments to create a ready-to-use PKanalix project, with covariate columns already tagged, but this can also be done through the interface after browsing the formatted dataset. The columns Id, Time, Conc and AMT are also tagged automatically in the project.
formatData(
  dataFilename = "ex1.csv",
  idHeader = "Id",
  timeHeader = "Time",
  obsHeader = "Conc",
  timeFirstDose = 0, doseAmount = 10,
  outputFilename = "adapted_dataset.xlsx"
  createProject = TRUE, catCov = "Sex", contCov = "Age"
)
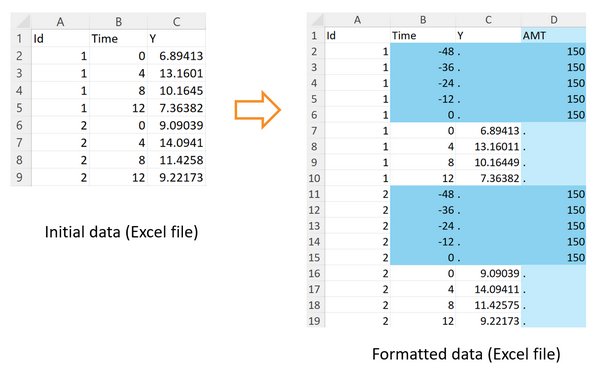
Multiple doses can be defined with the additional arguments doseInterval and nbDoses, and by specifying is.multiDose=TRUE.
formatData(
  dataFilename = "ex2.csv",
  outputFilename = "adapted_dataset.xlsx"
  idHeader="Id", timeHeader = "Time", obsHeader = "Y",
  timeFirstDose = -48, doseAmount = 150,
  is.multiDose = TRUE, doseInterval = 12, nbDoses = 5
)
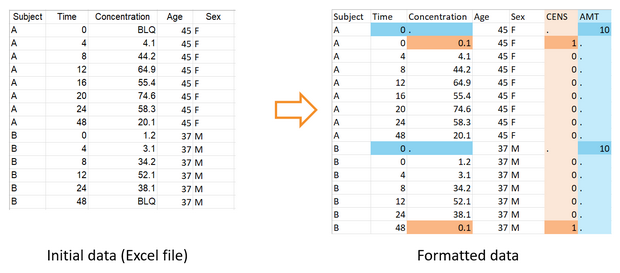
To be read by PKanalix, censored measurements (concentrations below the limit of quantification) must be encoded with a column tagged as CENSORING, with a value 1 on lines corresponding to censored concentrations, and 0 on other lines. In the column of concentrations, the LLOQ must be given instead of a censored concentration. That way, PKanalix has all the information on censored data and the user can then choose in the software how to handle this data (as missing, zero, LOQ or LOQ/2). The function formatData can adapt a dataset that contains only censoring tags in the column of concentrations (like “BLQ” in the example below). One or several censoring tags can be given as argument censTag, and the LLOQ to be used to replace those tags must be given as argument lloq.
If createProject=T, the new column CENS is automatically tagged as CENSORING in the new PKanalix project created by formatData.
formatData(
  dataFilename = "ex3.xlsx",
  idHeader = "Subject",
  timeHeader = "Time",
  obsHeader = "Concentration",
  timeFirstDose = 0, doseAmount = 10,
  censTag = "BLQ", lloq = 0.1,
  outputFilename = "adapted_dataset.xlsx"
  createProject = TRUE, catCov = "Sex", contCov = "Age"
)
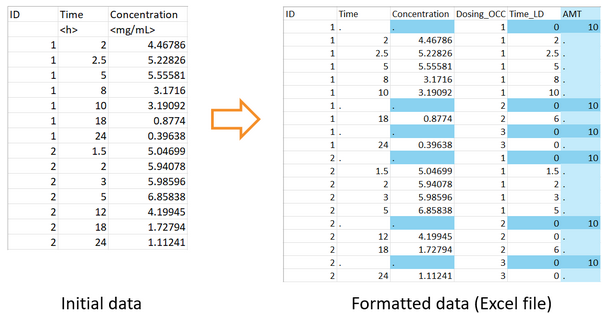
In this example, “Treatment” is given as argument occHeader. This column is then used to define occasions, which are separate periods of measurements for a single individual. Hence, doses are added for each treatment type and each subject. To consider occasions, PKanalix needs a column containing occasion indexes as integers. Since the column Treatment does not contain integers, the function formatData creates a new column Treatment_OCC with integers. If the argument createProject=T was used, the column Treatment_OCC would be automatically tagged as OCCASION in the PKanalix project.
It is possible to specify several columns in the argument occHeader.
formatData(
  dataFilename = "ex4.csv",
  outputFilename = "adapted_dataset.csv",
  idHeader = "Id",
  timeHeader = "Time",
  obsHeader = "Concentration",
  occHeader = "Treatment",
  doseAmount = 10, timeFirstDose = 0
)

formatData(
  dataFilename = "ex5.csv",
  outputFilename = "adapted_dataset.csv",
  idHeader = "ID", timeHeader = "Time", obsHeader = "Concentration",
  doseAmount = 10, is.multiDose = T, doseInterval = 12, nbDoses = 3,
  addOccperDose = T
)
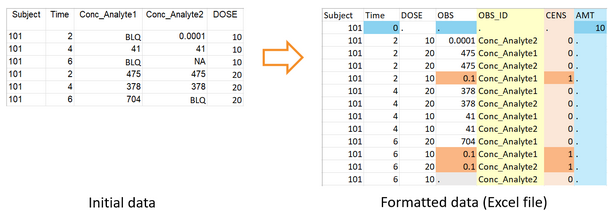
PKanalix can only read concentrations from a single column. If the user’s dataset contains concentrations of different types (in this example, from different analytes) in different columns, they can be specified as a vector of column headers in the argument obsHeader. The function formatData merges the two columns in a single column named OBS, and creates a column OBS_ID with flags to distinguish the two types of concentrations.
formatData(
  dataFilename = "ex6.xlsx",
  outputFilename = "adapted_dataset.csv",
  idHeader = "Subject",
  timeHeader = "Time",
  obsHeader = c("Conc_Analyte1", "Conc_Analyte2"),
  doseAmount = 10, timeFirstDose = 0,
  censTag = "BLQ", lloq = 0.1
)
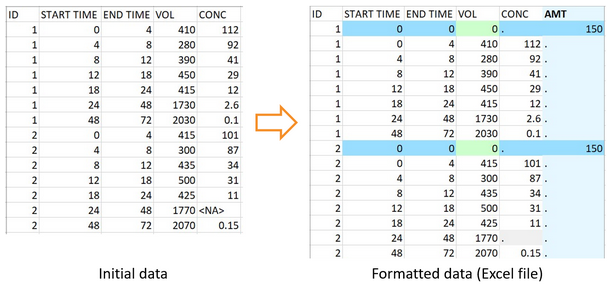
The function can adapt a dataset of urine data encoded with two columns for the start and end times of the urine collection time intervals. In PKanalix, a single time column is needed, with continuous time intervals starting at the time on the line before the considered concentration and ending on the current line. Thus the first line for each individual corresponds to the dose time, with no concentration. On that line, the function formatData sets the volume to 0, as required by PKanalix. The user must specify the data type with the argument dataType = “urine”, and the two time columns and the volume column with the arguments urineStartTimeHeader, urineEndTimeHeader and urineVolumeHeader.
Here the missing concentration for the interval between times 24 and 48 for id 2 is also replaced by a . compatible with PKanalix.
formatData(
  dataFilename = "ex7.csv",
  outputFilename = "adapted_dataset.csv",
  idHeader = "ID", obsHeader = "CONC",
  dataType = "urine",
  urineStartTimeHeader = "START TIME",
  urineEndTimeHeader ="END TIME",
  doseAmount = 150
)
Reporting
Steps
Reporting with RsPKanalix typically consists of several steps:
1. Preparation of a template
Template preparation consists of using Microsoft Word to create a report without tables, plots and parts of texts that are specific to a project you are working on. Typically, you would put unique placeholders on the lines in the document on which you want to generate tables and plots. You can name the placeholders as you want. An example of a report can be found in the supplementary materials (path).
2. Creating and running a PKanalix project
If you use formatData function, then it will automatically create a PKanalix project file saved next to your data file, and run the NCA task with selected settings for NCA. It is possible to open this project in the interface, or load this project with the connectors. You can directly use the results, or change the settings and run the project again. It is also possible to import the formatted dataset in the PKanalix interface, or create a project with this dataset through lixoftConnectors. After project creation, select the settings and run tasks such as NCA and Bioequivalence, either in the interface or through lixoftConnectors in R.
3. Generation of tables and plots
This step is done completely in R. You should create variables that contain output of the functions for specific tables and plots. The names of those variables should be the same as the text of a placeholder they are supposed to replace. Typical usage looks like this:
PLOT_INDIVOBS_LOG <- getPLOT_INDIVOBS(
  bLog = T,
  splitCat = "Analyte"
)
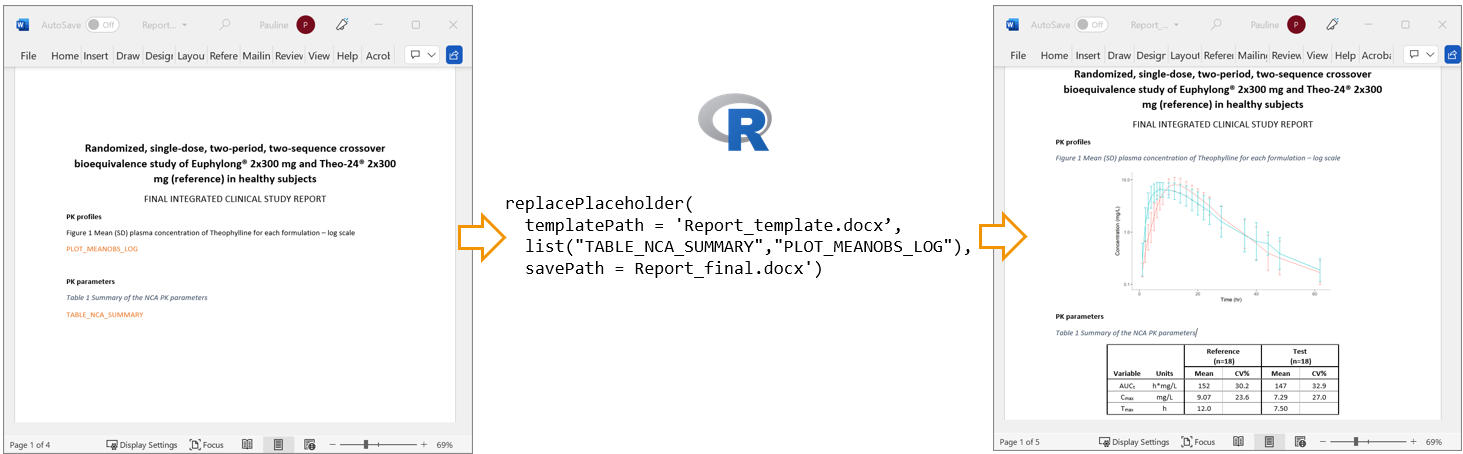
4. Placeholder replacement
This is a final part of an R script that generates the reports. It calls replacePlaceholder function which replaces the placeholders that you inserted in the report template and saves a file containing the generated report. Placeholders can be replaced with text, ggplot2 objects and flextable objects. This means that you can also generate plots using lixoftConnectors, not only RsPKanalix functions, and put them into reports as well.
If you name the objects that you want to insert exactly as the placeholder names in your report template, the object variables can be directly passed as arguments to the replace Placeholder function as below. This enables you to keep a simple syntax for replacePlaceholder, but it is possible only if you call replacePlaceholder in your main script (not inside a function).
replacePlaceholder(
  templatePath = "Report_template.docx",
  list("PLOT_MEANOBS_LIN", "PLOT_MEANOBS_LOG",
       "PLOT_INDIVOBS_LOG", list("PLOT_BOXPLOT_CMAXD", 4, 3),
       list("PLOT_BOXPLOT_CAVG", 4, 3), "TABLE_NCA_SUMMARY",
       "TABLE_NCA_PARAM", "TABLE_NCA_RATIO",
       "PLACEHOLDER_FORMULATION", "PLACEHOLDER_AMOUNTS"),
  savePath = "generated_report.docx"
)
Example usage
Below is the list of tables and plots that can be generated with RsPKanalix package. In these examples we compare parameters and check the bioequivalence for two formulations called “Reference” and “Test”, which are the two values of a categorical covariate called FORM in the dataset.
Tables
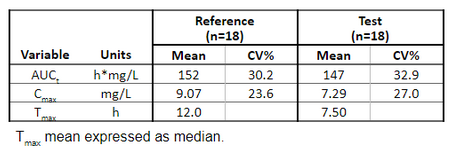
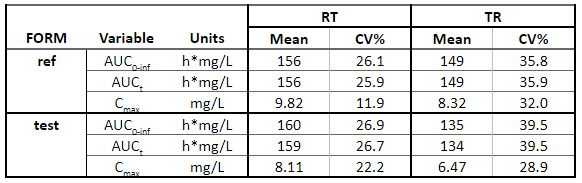
getNCASummaryTable(
  paramListSummary = c('Cmax','AUClast','Tmax'),
  asMedian = c('Tmax'),
  horizCatName = "FORM",
  renameHorizCat = c("ref" = "Reference",
                     "test" = "Test")
)
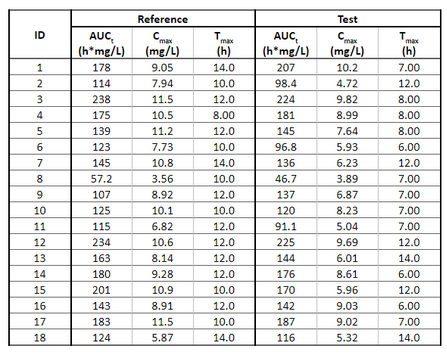
getNCAIndivTable(
  paramListIndiv = c("Cmax","AUClast","Tmax"),
  horizCatName="FORM",
  stat = NULL,
  renameHorizCat = c("ref" = "Reference",
                     "test" = "Test")
)
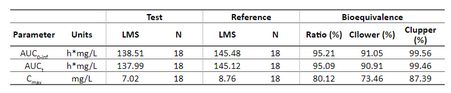
getBETable(renameFormulations = c("ref" = "Reference", "test" = "Test"))
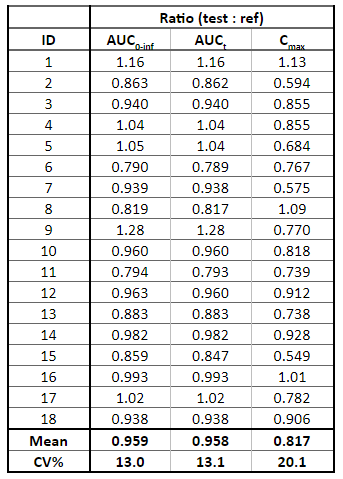
getNCARatioTable(
  paramListIndiv = c("AUCINF_obs", "AUClast", "Cmax"),
  ratioCatName = "FORM"
)
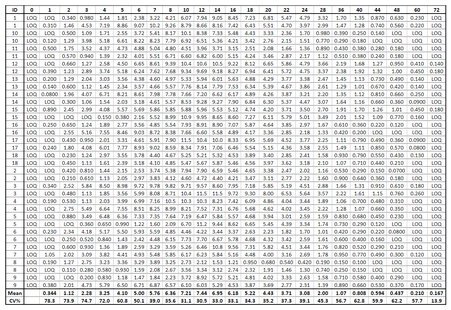
getConcTable(displayOCC = F)
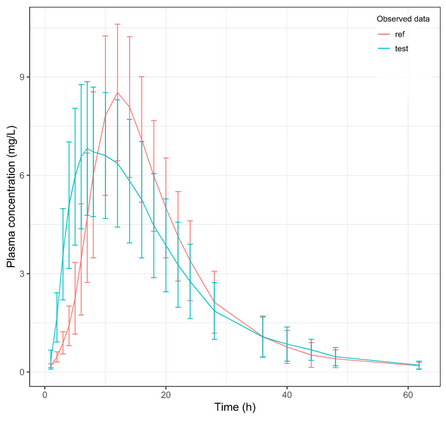
Plots
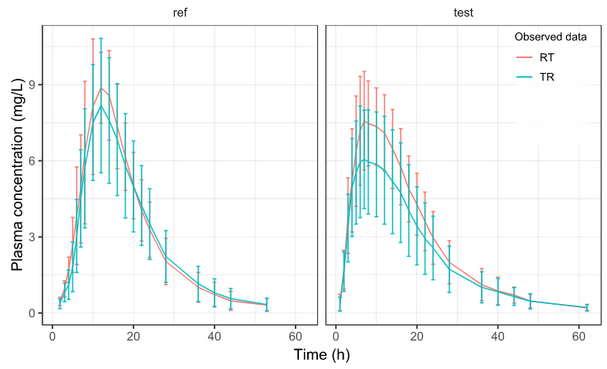
getPLOT_MEANOBS(colorCat = "FORM", splitCat = "Period")
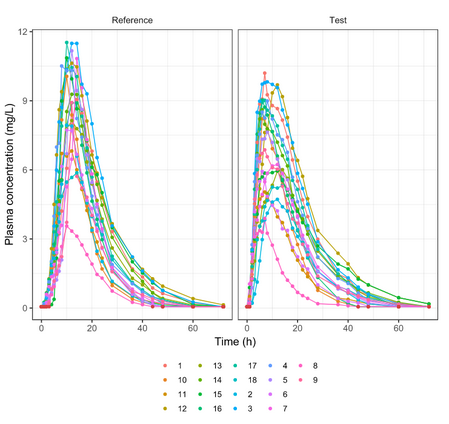
getPLOT_INDIVOBS(
  splitCat = "FORM",
  renameSplitCat = c("ref" = "Reference",
                     "test" = "Test")
)
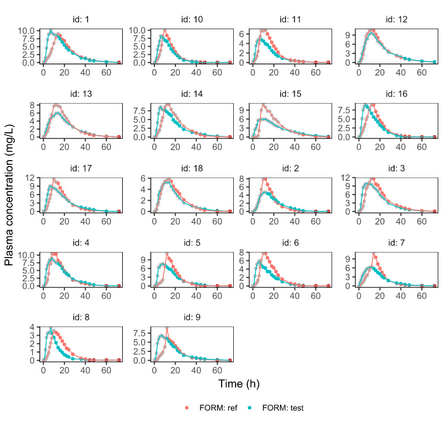
getPLOT_byINDIV(colorCat = "FORM")
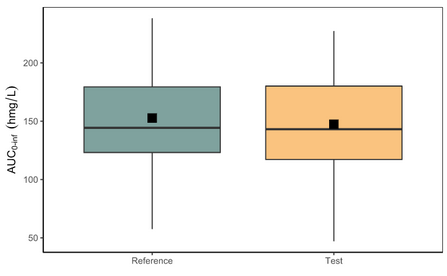
getBOXPLOT(
  param = c("Cmax", "AUClast", "AUCINF_obs"),
  colorCat = "FORM",
  renameColorCat = c("ref" = "Reference",
                     "test" = "Test"),
  addPoint = F
)
Stratification of tables and plots
Tables
Tables available through the package include stratification options as well. Table stratification is done by splitting the data horizontally and/or vertically using horizCatName and vertCatName arguments.
Here are several examples of how to use these arguments to stratify the NCA summary table.
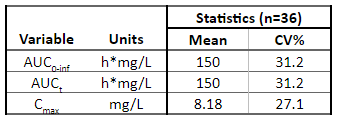
getNCASummaryTable(param = c("Cmax", "AUClast", "AUCINF_obs"))
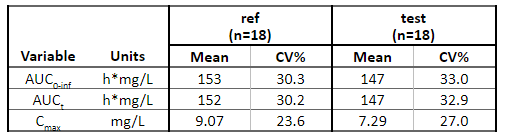
getNCASummaryTable(
  param = c("Cmax", "AUClast", "AUCINF_obs"),
  horizCatName = "FORM"
)
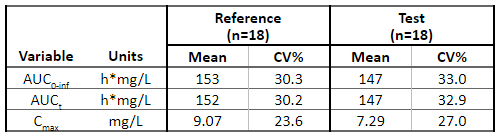
getNCASummaryTable(
  param = c("Cmax", "AUClast", "AUCINF_obs"),
  horizCatName = "FORM",
  renameHorizCat = c("ref" = "Reference", "test" = "Test")
)
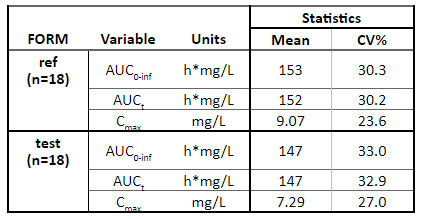
getNCASummaryTable(
  param = c("Cmax", "AUClast", "AUCINF_obs"),
  vertCatName = "FORM"
)
getNCASummaryTable(
  param = c("Cmax", "AUClast", "AUCINF_obs"),
  vertCatName = "FORM",
  horizCatName = "SEQ"
)
Plots
Most of the plots available in the RsPKanalix package contain several options for plot stratification. These options are available through colorCat, colorCat2 and splitCat arguments and their respective rename and filter arguments.
Let’s take a look at how mean observed data plot looks like with various stratification options.
getPLOT_MEANOBS()
getPLOT_MEANOBS(colorCat = "FORM")
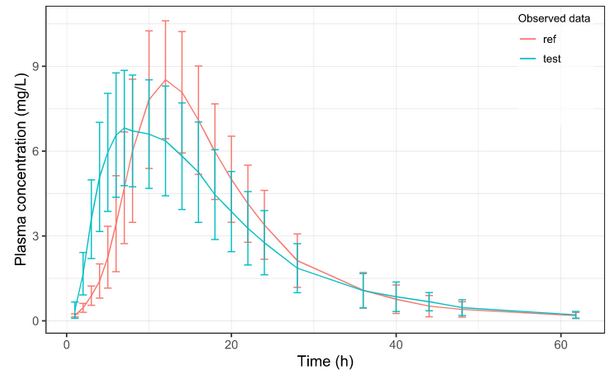
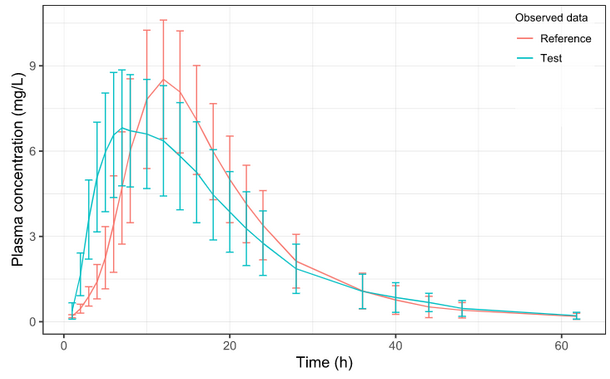
getPLOT_MEANOBS(
  colorCat = "FORM",
  renameCat = c("ref" = "Reference", "test" = "Test")
)
getPLOT_MEANOBS(colorCat = "FORM")

getPLOT_MEANOBS(splitCat = "FORM", colorCat = "SEQ")
Quick start
We are providing an example script that loads the single dose, crossover dataset attached to this manual, formats it and runs NCA and Bioequivalence using adaptDataPkx and creates a report with replacePlaceholders.
# load lixoftConnectors and RsPKanalix libraries
library(lixoftConnectors)
initializeLixoftConnectors(software = "pkanalix")
library(RsPKanalix)
# adapt Theophylline dataset for PKanalix
formatData(dataFilename = "initial_dataset.xlsx",
idHeader = "ID", timeHeader = "TIME", obsHeader = "CONC",
occHeader = "PERIOD", doseAmount = 600,
timeFirstDose = 0, censTag = "BLQ",
lloq = 0.06,
createProject = T, contCov = c("AGE", "WT"), catCov= c("FORM", "SEQ"),
outputFilename = "adapted_dataset.csv")
# load created project
loadProject('adapted_dataset.pkx')
# set units and run estimations (can be done in the GUI as well)
setDataSettings(units = list("dose" = "mg",
"time" = "h",
"volume" = "L"),
enableUnits = TRUE)
saveProject()
runNCAEstimation()
runBioequivalenceEstimation()
# Reporting: get relevant tables and plots as objects
# Here we name objects as the placeholders in our report template file
TABLE_NCA_SUMMARY <- getNCASummaryTable(
paramListSummary = c('Cmax','AUClast','Tmax'),
asMedian = c('Tmax'),
horizCatName = "FORM",
renameHorizCat = c("ref"="Reference", "test" = "Test")
)
TABLE_NCA_INDIV <- getNCAIndivTable(
paramListIndiv = c("Cmax","AUClast","Tmax"),
horizCatName="FORM",
stat = NULL,
renameHorizCat = c("ref"="Reference", "test" = "Test")
)
TABLE_BE <- getBETable(
renameFormulations = c("ref"="Reference","test"="Test")
)
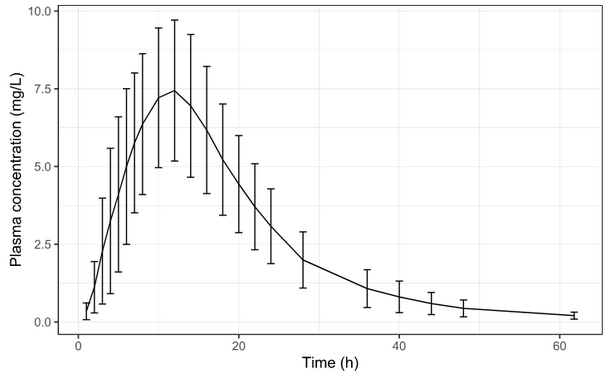
PLOT_MEANOBS_LOG <- getPLOT_MEANOBS(colorCat = "FORM", bLog = T)
PLOT_MEANOBS_LIN <- getPLOT_MEANOBS(colorCat = "FORM", bLog = F)
PLOT_INDIVOBS_LOG <- getPLOT_byINDIV(colorCat = "FORM", bLog = T)
PLOT_INDIVOBS_LIN <- getPLOT_byINDIV(colorCat = "FORM")
# using lixoftConnectors to generate plots
PLOT_NCA_FITS_ref <- plotNCAIndividualFits(
settings = list(obsDots = T, obsLines = F,
lambda_z = T, splitOccasions = T,
ylog = T,grid = F,
ylab = "Concentration (mg/L)",
xlab = "Time (hr)"),
stratify = list(filter = list(name = "FORM", cat = "ref"))
)
PLOT_NCA_FITS_test <- plotNCAIndividualFits(
settings = list(obsDots = T, obsLines = F,
lambda_z = T, splitOccasions = T,
ylog = T, grid = F,
ylab = "Concentration (mg/L)",
xlab = "Time (hr)"),
stratify = list(filter = list(name = "FORM", cat = "test"))
)
PLOT_BOXPLOT <- getBOXPLOT(
param = c("Cmax", "AUClast", "AUCINF_obs"),
colorCat = "FORM",
renameCat = c("ref"="Reference", "test" = "Test"),
addPoint = F
)
# using strings to replace the placeholders
DATE <- "05/30/2022"
# generate final report by replacing placeholders in the template
replacePlaceholder(
templatePath = 'Report_template.docx',
list("TABLE_NCA_INDIV", "TABLE_NCA_SUMMARY", "TABLE_BE", "PLOT_MEANOBS_LIN",
"PLOT_MEANOBS_LOG", list("PLOT_INDIVOBS_LOG", 6.5, 6),
list("PLOT_INDIVOBS_LIN", 6.5, 6), "PLOT_BOXPLOT", "DATE",
list("PLOT_NCA_FITS_ref", 6.5, 8), list("PLOT_NCA_FITS_test", 6.5, 8)),
savePath = 'Report_final.docx'
)